Self-study lesson plans and training record download page.
Understand how the power unit design guide works
This module explains the calculations behind our power unit design guide. It clarifies the parameters you need to enter into the software and explains the basis and significance of the results.
Enter Load Data
First make sure that the lock symbols in the product selection show as unlocked, or click to unlock. With the pump size fixed, for example, you will not be able to change the flow.
Use the met/Imp button to select your preferred units.
Enter your system's working pressure in the edit box or adjust the slide bar. Repeat this to set the desired flow, but remember the actual flow will be calculated from the pump size, speed, and volumetric efficiency. Set % time at P for your load e.g. the % time the system will operate at full load pressure. This is used to calculate the temperature rise rate and therefore how much cooling the system needs.
To create a full map of your system's performance you can save the data from several different operating conditions and copy them into a spreadsheet to produce a more comprehensive graph.
Click the pencil icon to open the detail load data editor.
Describe all relevant details about your load. Details of max. min. startup, duty, environmental, shock, failure, maintenance etc. can all affect the design specification.
Set the % of input power that generates heat. All input power that is not used by the load can be considered as going to heat. This will depend on individual system designs but typically could be 15% for a directional valve or 30% for a proportional valve. The program uses this to calculate the temperature balance and cooling requirement.
Set the % of input power that is used on standby. Standby is when the pump is running but no useful work is being done. The time on standby is set in the main screen by 100% less the % time at P. This is also required to calculate the thermal balance of the system.
The graph shows a representation of how the load will be modeled by this program.
Enter Motor Data
Select the type of drive motor you require, for example, an AC 50Hz or 12VDC electric motor. This loads a generic data file for each motor type, although specific data files for different manufacturer products can also be added. The motor voltage is likely to be set by the factory location or vehicle conditions. The program should warn if the motor range selected does not have a power rating sufficient for the load required.
The program will then select an electric motor size to suit the load requirements you have added. The program adds a 15% oversize margin on the electric motor to stalling. If you prefer you can select the motor size you have or prefer and lock this in the design by pressing the lock symbol.
When a DC motor is selected an additional box appears to allow users to select the motor duty required. The program does not link this to performance or duty ratings but it will be recorded within the results to allow quotations to be provided. If you are unsure of which electric motor would be the most appropriate then simply enter as much information about your operating conditions as you can and pass the design guide output file to one of our specialist suppliers.
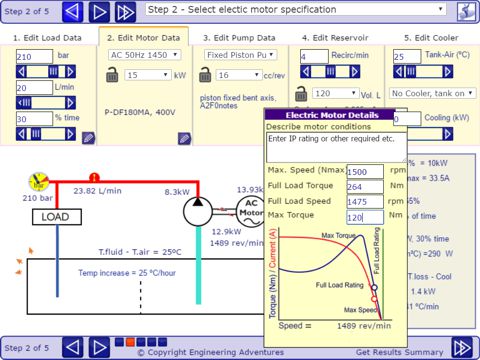
Select the pencil icon to open the motor detail editor.
AC motors are defined by their Maximum Speed, Full Load Torque, Full Load Speed and Maximum Torque.
The curve provided shows a typical AC motor characteristic and the vertical green line shows the point at which the motor is operating under the working conditions set on the main screen.
Users can add their own electric motor data based on the performance graph shown. However, this should only be used as a guide for how the equipment will perform. Final designs should always be checked by the manufacturer sales agents who should have access to more accurate performance data.
DC Motors are defined by their polynomial curve for speed against torque. These vary widely between motor so care must be taken to select the right one. Users can pick from the available list of motor numbers or add their own curve characteristic by specifying the coefficients for a, b and c. These can be found by plotting the curve in Excel then using a trend line calculate the coefficients.
The voltage is not used in the program calculations so provided the same performance information is provided for a DC electric motor, the simulation should give a reasonable representation of the expected performance. The vertical green line shows the point at which the motor is operating under the working conditions set on the main screen.
Enter Pump Data
The program contains a range of different hydraulic pump sizes in both fixed and variable displacement. The generic valves are based loosely on a piston pump for the variable displacement pump and a less efficient gear pump for the fixed displacement pump.
The pump data contains both volumetric and mechanical/overall efficiency calculations. Volumetric efficiency is applied against pressure, giving less flow the higher the pressure gets. Overall efficiency calculations are less precise. The program uses overall figures as mechanical efficiency curves are not readily available. However, because the program already uses the volumetric to control the speed, the overall figures can be above the volumetric at higher pressures, which should not, in theory, be possible. while overall efficiency is applied against pressure and speed. The generic values used in this program can only be taken as a guide of what's likely to be happening. Add your own values for specific products to get accurate results.
In real life, the efficiency values are very complex and include variations in temperature, pressure, speed, fluid, lifecycle, duty and potentially others. While the generic pump values used in the design guide may be a broad approximation, the program does allow the user to put in more accurate supplier efficiency values and then experiment with operating conditions to gain a better understanding of the likely effects.
You MUST look at each individual pump's efficiency curve and enter the data into the program to get accurate results at your particular operating conditions.
Enter a description of the pump operating conditions into the top text area. This should include drive style, suction head, mounting and isolation etc.
The volumetric efficiency is described by one figure for the worse case at maximum pressure. Therefore the flow at any particular time is equal to the pump displacement x speed x (working to pump max pressure ratio x efficiency loss)
The overall efficiency is described by the polynomial curve values. This allows for more complex curves to be added. These are likely to be more relevant when looking at standby heat generation or variable speed, DC applications. The program applies a general curve for both flow and pressure therefore each case needs to be looked at in detail and it may be that one curve is added to make tests of varying pressure and another for test of varying speed.
Fluid temperature is taken as 40C so changes will need to be made if systems only work from cold, for short periods etc..
Calculations of drive shaft power are based on the pump efficiency curve using aX^2 + bX + c
Calculation Details
Installed Torque and Power: The drive system must always be capable of providing more power than you need. Actual valves will depend on which drive motor selected but this will always be higher than the energy the system consumes.
Motor Input Power: The power required by the drive motor is the energy the system requires and therefore what you would have to pay for. This figure is used as 100% against which other power consumptions are measured. Input power is calculated from the output power of the drive motor plus the inefficiency losses.
Motor Output Power: Assuming a direct drive is used with zero power loss, the output power from the drive motor equals the input power to the hydraulic pump. The power required by the pump is calculated by the output power of the pump plus pump inefficiency losses.
Pump Output Power: Is calculated from working pressure and actual flow at the pump.
Load Power: Not all of the power provided by the pump will be used by the load. A percentage of the available power will always be converted into heat. The actual percentage value can be entered via the load editor window and this amount is deducted from the pump outlet power, to give the load power consumption.
Standby Power Loss: While on standby e.g. waiting for the full load operation, each system will still consume some power. The actual value may vary greatly depending on the type of pump and duty required. The percentage of full load power can be entered via the load editor window and is used to calculate the standby power loss and also the reservoir temperature rise rate.
Reservoir Heat Loss: Provided the fluid temperature is higher than the air temperature, the reservoir will dissipate heat and help maintain a stable fluid temperature. By increasing the fluid-air temperature difference this design guide can be used to predict the temperature at which it will stabilise.
Cooler Heat Loss: Use the fluid cooler section to establish what size of cooler is required to maintain a stable hydraulic system temperature.
Export the Result to a Spreadsheet
Once you have decided on the most appropriate design you can export the results to Excel or any other spreadsheet. Use the 'Get Results' to go to the results page. On the registered version you can copy or email the data to your PC. With the unregistered version, the data will be emailed to yourself and a potential supplier in your area.
Next Open Excel. Paste your comma-separated values into the document, column 1.
Select column 1 and open the 'DATA' tab.
Click on the 'Text to Columns' button and follow the wizard (delimited-comma).
You will then have an excel table you can manipulate as required.
Make sure you check the results with your own calculations in Excel or Mathcad etc.